
Order-of-Magnitude Estimation and the BP Oil Spill
Order-of-Magnitude Estimation and the BP Oil Spill
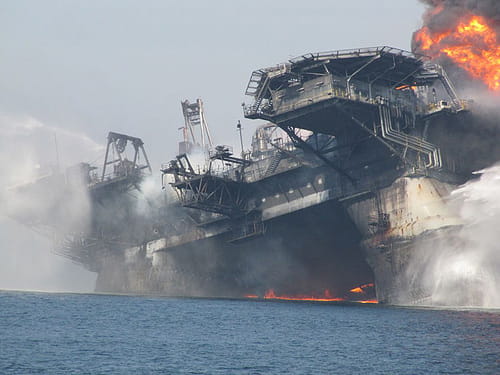
On April 20, 2010, “Deepwater Horizon,” an oil rig owned by British Petroleum (BP) and Transocean, exploded off the shore of Louisiana, pouring oil and gas into the Gulf of Mexico. The press reported estimates for the oil spill rate that varied widely. Through mid-May, government-sponsored estimates ranged up to 5000 bbls/day (bbl = barrel; 1 barrel is 42 gallons). Early, non-official, independent estimates based on the visual appearance of the surface slick ranged up to 20000 bbls/day. As someone who read newspaper headlines, I saw the reported rates rise with each passing day of the unfolding environmental disaster.
During the late evening of May 12, 2010, an email invitation was sent to Berkeley faculty working in fluid mechanics, challenging them to estimate the oil spill rate based on a YouTube video of the leaking pipe just released to the public by BP. The PBS Newshour was soliciting estimates based on the video.
I teach a course in order-of-magnitude estimation and so a challenge like this was too good to resist.
I happened to be awake at the time the email announcing the challenge arrived in my inbox. I clicked on the YouTube video, scribbled some numbers, sent in my entry, and went to bed. The calculation seemed straightforward except for the fact that there was no scale bar for length on the video, and so I had to estimate the diameter of the pipe and the flow speed using other considerations, which I explained as part of my email.
When I got into work the next morning, I was shocked to find my answering machine clogged with more than a dozen messages. They were all from reporters asking for more information. I probably spent half my working hours that day fielding questions by phone and by email. Some requested that I come into their television studios to describe “my method” for the evening news. I imagined myself waving my hands and doing high-school algebra on national television and declined these requests.
Back then in mid-May, the fastest reporter on the scene, and one of the most thoughtful, was Richard Harris of National Public Radio (NPR), who put together this article, with audio. In my original email to the PBS Newshour, my estimate was 100000 bbls/day, but when Mr. Harris informed me that the pipe that is visible in the video actually encloses a (not visible) pipe that is about half its diameter and that is the one actually leaking, I hedged my bet accordingly and said during the NPR interview that the flow rate could be anywhere between “20000 and 100000 bbls/day”.
On the one hand I was pleased to learn from Harris’s article that other people, using far more sophisticated and accurate techniques to analyze the video, had gotten similarly high estimates. On the other hand the numbers implied that the spill had already exceeded that of the Exxon Valdez, and that there were some serious errors underlying the then-official estimate of “5000 bbls/day”.
In October 2010, I was sent a copy of a draft for “Staff Working Paper No. 3” on “The Amount and Fate of the Oil”, a report assembled by the National Commission on the BP Deepwater Horizon Oil Spill and Offshore Drilling. I had been interviewed by this commission, and it contains what I had to say as well as a well-researched and surprisingly readable account of the various and sundry estimates of spill rate that people had calculated and re-calculated. The report cites a final official rate, as calculated by the government’s “Flow Rate Group” and a team of experts led by Energy Secretary Chu, of 52700-62200 bbls/day from April-July 2010. A grand total of 4.9 million barrels of oil have been spilled (for comparison, the Exxon Valdez spill was roughly an order of magnitude smaller). According to wikipedia, although the well has been capped, oil may still be leaking out.
The lessons I draw from this episode are lessons that cry out to be acknowledged in one form or another every day. First, and obviously, our addiction to fossil fuels is destroying the environment. Second, the estimate of spill rate could have been made by anyone with a working knowledge of pre-college (and in some countries, grade-school) level math and science, plus a healthy dose of common sense. Without any understanding of fluid dynamics, one can look at the video, make some common-sense guesses for the size of the pipe and the flow velocity, recall some basic geometry and dimensional analysis, and arrive at a “ballpark number” for the spill rate. I was surprised how few such estimates were being made when the video was released; people, even scientists, were leaving it for “experts”. Plenty of people have the ability to make such estimates, but seem too lazy or frightened to try. Breaking down the barrier to quantitative reasoning is something that people in my line of work are always trying to do. How much sounder would our public policy be if we had a quantitative basis for deciding what is “small” and what is “big” — what is “minor” and what is “important” — what is environmentally “tolerable” and what is “catastrophic” — by doing a few simple sums, in our head or on paper.